


Cincinnati public scares
A look into the correlation between JH academic proficiency and disadvantages
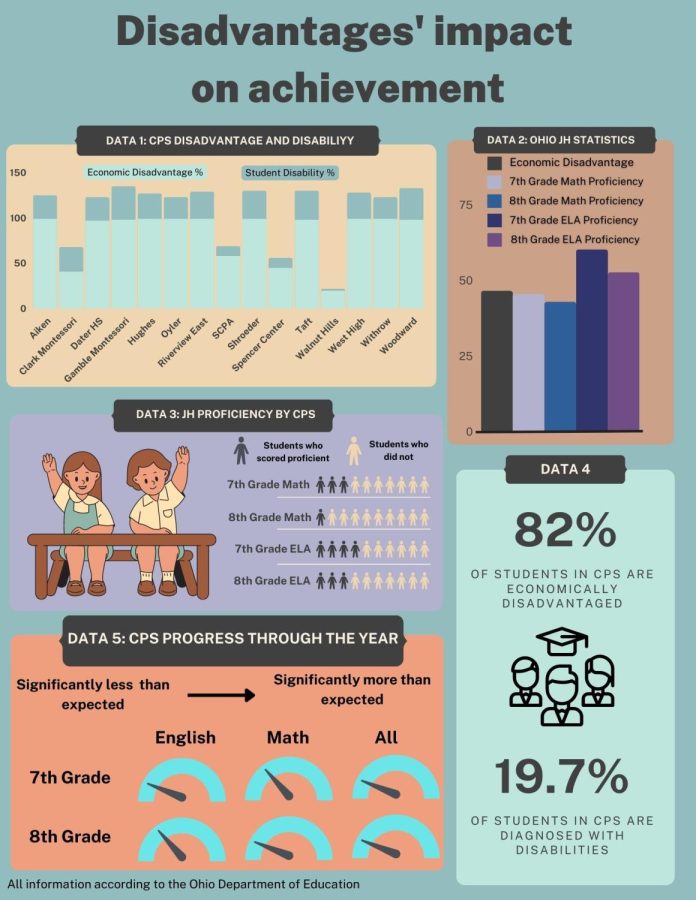
An infographic showing different advantages and disadvantages within the school system. This was made using Canva.
February 13, 2023
As students progress through the ranks of learning, from elementary schools all the way to highschool and maybe beyond, all schools strive to fill their students with as much information and knowledge as they can along the way. However, that does not mean that all students receive the same opportunities in terms of ability to learn due to outside factors such as disabilities and disadvantages, physically, mentally and economically.
According to the National Association of Secondary School Principals, “Students living in poverty often have fewer resources at home to complete homework, study, or engage in activities that helps equip them for success during the school day.” Nothing shows a clearer example of this than WHHS’ very own district, Cincinnati Public Schools (CPS).
CPS encompasses 65 schools in total, 16 of which are highschools. Of all CPS highschools, only two schools score four or more stars out of five based on their academic achievement (WHHS and Spencer Center for Gifted and Exceptional Students), while the other 14 score an average of only 1.2 stars.
A strong correlation exists between the CPS districts’ general lack of academic success and the vast percentages of disadvantages found among the students enrolled. As you can see in Data 1, 4, and 5, a great sum of students in the CPS district live with economic disadvantages and physical disabilities. In the schools with the highest disadvantage rates, the number of 7th and 8th students who score proficiently in math and English are frighteningly low.
In the case of ELA proficiency, only the five schools in the district possess students who score higher than 30% proficiency in both the 7th and 8th grades. The proficiency gets worse in math, with only three schools scoring above the 30% mark through both JH grades, all three of which are three of only four schools within the district that don’t have above 98% economic disadvantage in their schools. The drastically low proficiency scoring rates in CPS can be seen in Data 3, where not a single grade or subject has more than every 4th kid in the district being proficient.
This trend can also be seen on a larger scale when comparing the same statistics within the state of Ohio. As can be seen in Data 2, nearly half the students in Ohio are economically disadvantaged and roughly the same number of JH students scored proficient in math and English.
According to Chalkbeat, a nonprofit organization that covers news on American education, there’s a widely used anti-poverty program known as the Earned income tax credit which has been shown to improve schooling outcomes for kids. The program was used by 27 million families in 2017 and at least two studies have been conducted on it, both showing results of rising scores in times after the earned income tax credit became more generous. Programs like this one can serve to address and improve the poverty rates among students and in turn maybe overall test scores too.


![Fiona Kelley, 28, poses with her friends, ready to have good night at the Twilight Ball. I think this [dance] is gonna be really fun, Kelley said.](https://whhscbox.com/wp-content/uploads/2024/04/fiona-kelley-and-friends-600x400.jpg)


![Dean Miller-Graham enjoys Samantha Stephensons class not only because of friends, but [because] its just a good environment.](https://whhscbox.com/wp-content/uploads/2024/02/classroom-side-1-600x400.jpg)